Nexedi

Nexedi is Europe's largest open-source software (OSS) publisher and creator of ERP5. At Nexedi, we design, develop and deploy enterprise solutions ranging from ERP to pure Decentralized Cloud and Industrial Big Data.
SlapOS: Hyperconvergence OS

We are everywhere
3 Masters
VIFIB (Hyperconvergence as a Service)
Teralab (KVM and Big Data)
Grandenet (ADN/CDN + Mesh Network)
+150 Computers on 11 Countries (Including China)
From Cloud to local servers, from large Bullion Servers to tinny raspiberry pi.
1 Single Monitoring app for rule them all
2 Persons only to manage them all
Where does slapos collect data from?
- CPU
- Memory
- Disk (usage / io)
- Network (usage / io / addresses)
- Platform Information
This is what most of what you need to monitor, but we are working to include logs.
How does SlapOS collect data?
slapos node collect
Taking Snapshots from all Processes
    def current_state(user_dict):
          """
          Iterator used to apply build_snapshot(...) on every single relevant process.
          A process is considered relevant if its user matches our user list, i.e.
          its user is a slapos user
          """
          process_list = [p for p in process_iter() if p.username() in user_dict]
          for i, process in enumerate(process_list):
              yield build_snapshot(process)
https://lab.nexedi.com/nexedi/slapos.core/blob/master/slapos/collect/__init__.py#L62Taking Process Snapshots
    class ProcessSnapshot(_Snapshot):
          """ Take a snapshot from the running process
          """
          def __init__(self, process=None):
              assert type(process) is psutil.Process
              ui_counter_list = process.io_counters()
              self.username = process.username()
              self.process_object = process
              self.pid = process.pid
              # Save full command line from the process.
              self.process = "%s-%s" % (process.pid, process.create_time())
              # CPU percentage, we will have to get actual absolute value
              self.cpu_percent = self.process_object.cpu_percent(None)
              # CPU Time
              self.cpu_time = sum(process.cpu_times())
              # Thread number, might not be really relevant
              self.cpu_num_threads = process.num_threads()
              # Memory percentage
              self.memory_percent = process.memory_percent()
              # Resident Set Size, virtual memory size is not accouned for
              self.memory_rss = process.memory_info()[0]
              # Byte count, Read and write. OSX NOT SUPPORTED
              self.io_rw_counter = ui_counter_list[2] + ui_counter_list[3]
              # Read + write IO cycles
              self.io_cycles_counter  = ui_counter_list[0] + ui_counter_list[1]
https://lab.nexedi.com/nexedi/slapos.core/blob/master/slapos/collect/snapshot.py#L44
Collecting Computer Usage
    class SystemSnapshot(_Snapshot):
          """ Take a snapshot from current system usage
          """
          def __init__(self, interval=MEASURE_INTERVAL):
              cpu_idle_percentage = psutil.cpu_times_percent(interval=interval).idle
              load_percent = 100 - cpu_idle_percentage
              memory = psutil.virtual_memory()
              net_io = psutil.net_io_counters()
              self.memory_used = memory.used
              self.memory_free = memory.free
              self.memory_percent = memory.percent
              #self.cpu_percent = psutil.cpu_percent()
              self.cpu_percent = load_percent
              self.load = os.getloadavg()[0]
              self.net_in_bytes = net_io.bytes_recv
              self.net_in_errors = net_io.errin
              self.net_in_dropped = net_io.dropin
              self.net_out_bytes = net_io.bytes_sent
              self.net_out_errors = net_io.errout
              self.net_out_dropped = net_io.dropout
import slapos.collect
          # pip install slapos.core
          from slapos.collect.snapshot import ComputerSnapshot
          snapshot = ComputerSnapshot()
          from slapos.collect.snapshot import ProcessSnapshot
          psnapshot = ProcessSnapshot(psutil.process(os.getpid()))
On slapos, we run "slapos node collect" but you can use as a library.
Database and Local Report
          # Import Dabase, Take Snapshot and build an report
          from slapos.collect.db import Database
          from slapos.collect.entity import Computer
          from slapos.collect.snapshot import ComputerSnapshot
          database = Database("/tmp")
          computer = Computer(ComputerSnapshot())
          computer.save(database, collected_date, collected_time)
          consumption_report = ConsumptionReport(...)
          consumption_report.buildXMLReport(date)
You can use slapos.core as library to build consumption reports (in xml) for your running application.
Why does slapos collect Data ?
- Monitor
- Invoicing
- Detect Failures and Tickets (Big Data)
Monitoring
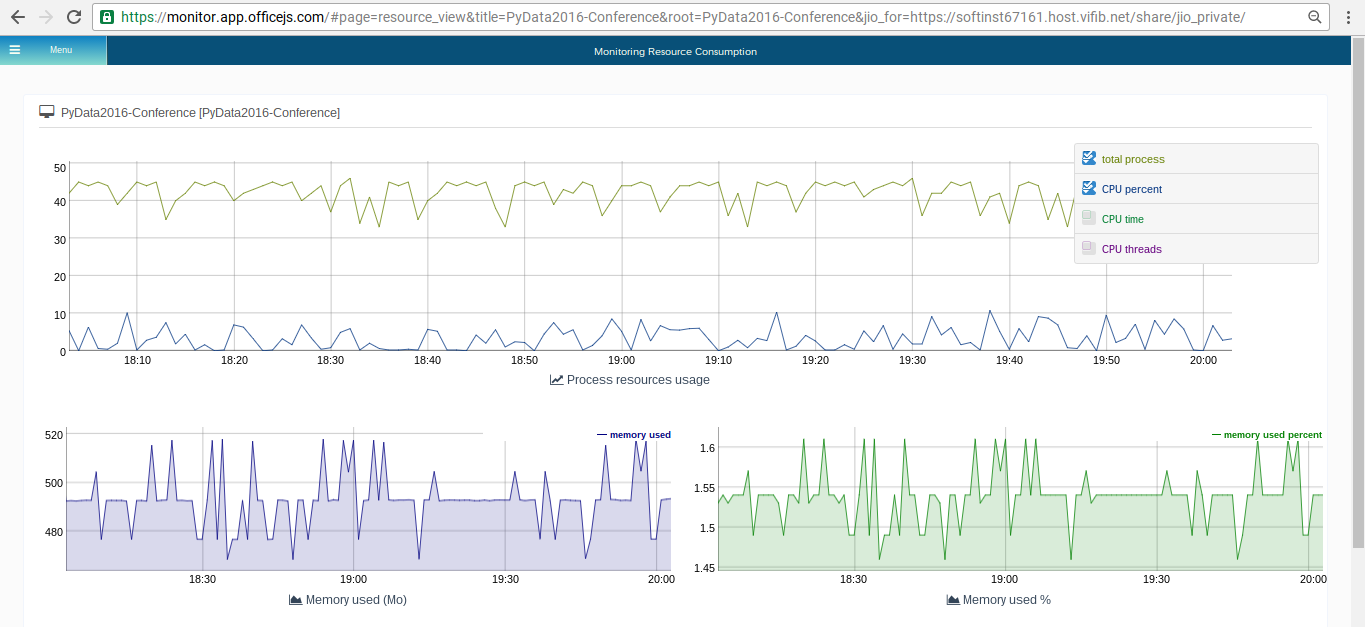
Multi-Master and Multi-Cloud support
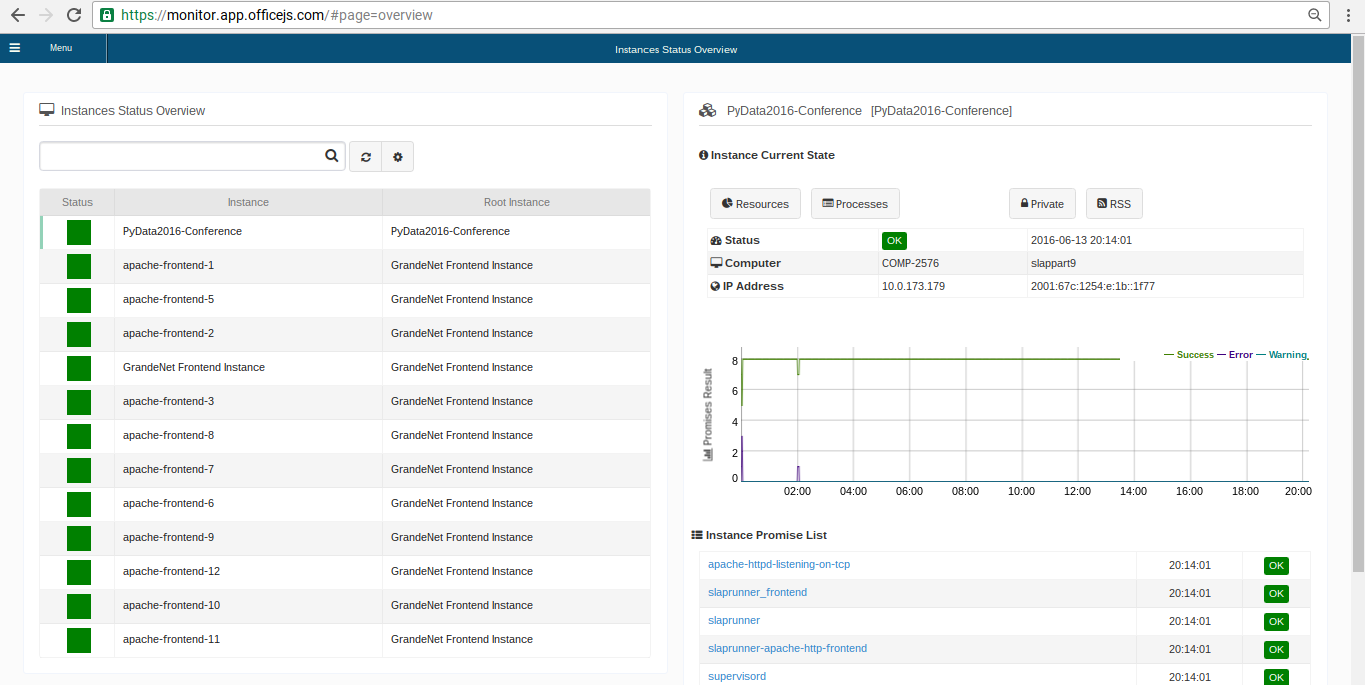
Monitor Instance List
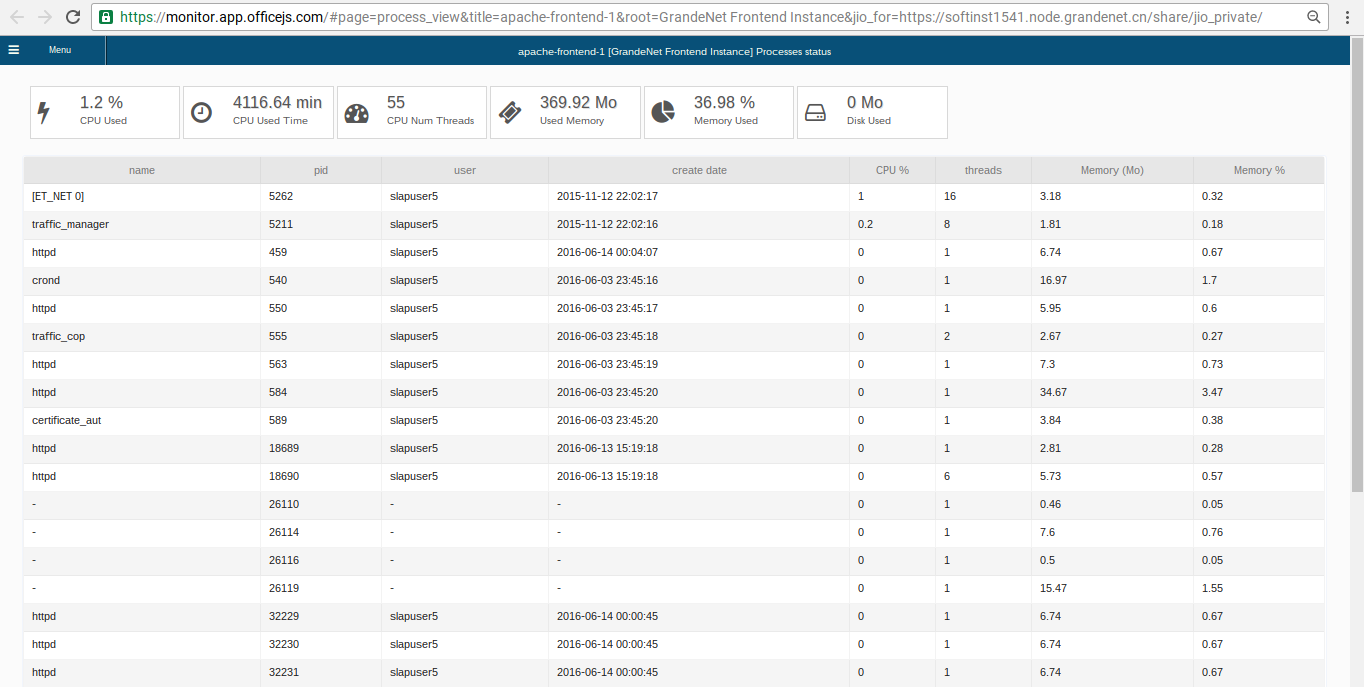
Monitor Process List
Invoicing and consumption reports
slapos node report
OR
    import slapos
          slap = slapos.slap.slap()
          slap.initializeConnection(server_url)
          computer = slap.registerComputer(computer_guid)
          computer.reportUsage(consumption_report.xml)
Daily all computers upload their consumption_report.xml to Slapos Master.
From Collected Data to the Invoice
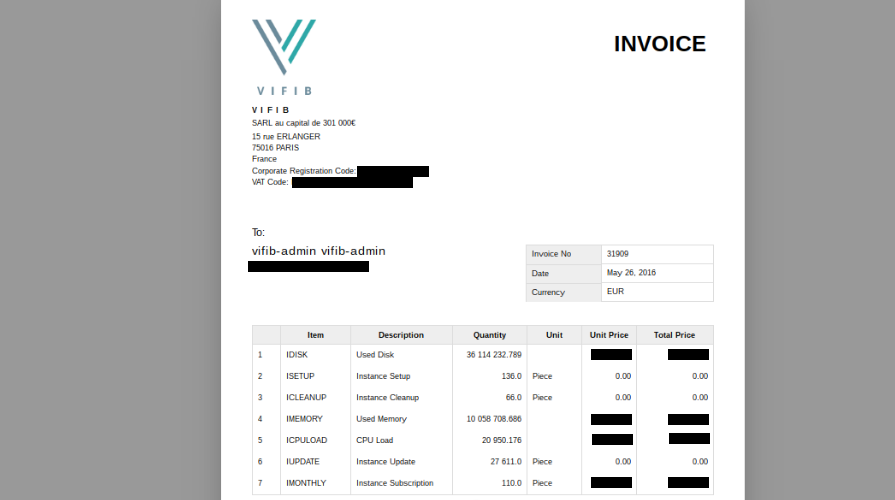
VIFIB, Teralab and Grandenet has their own pricing, templates and business processes.
Consumption Reports
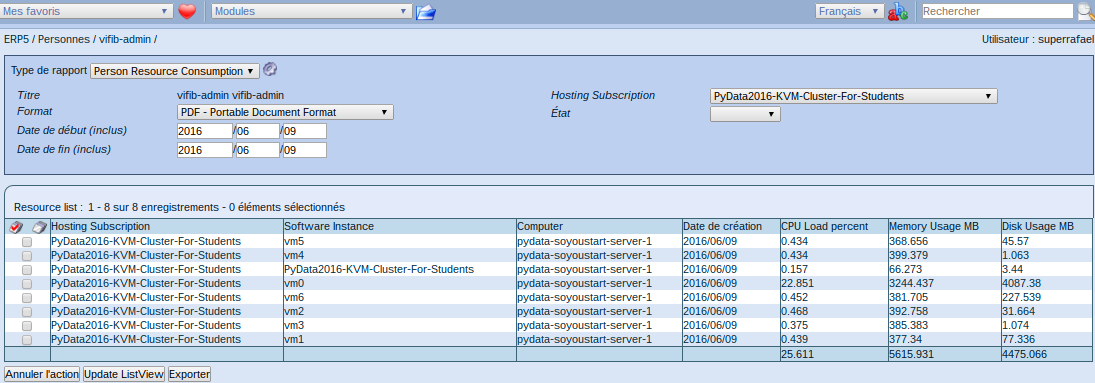
How much prepare a class consumes in resources at begin..
Big Data goes to wendelin
Browser has limitations ....
- 1 Partition can produce +80k entries on a sqlite per day
- 1 Computer can produce ~40MB per day on CSV files
- 150 Computer can produce +6GB per day in CSV files
... and we didn't include access logs.
Pushing Data to Wendelin
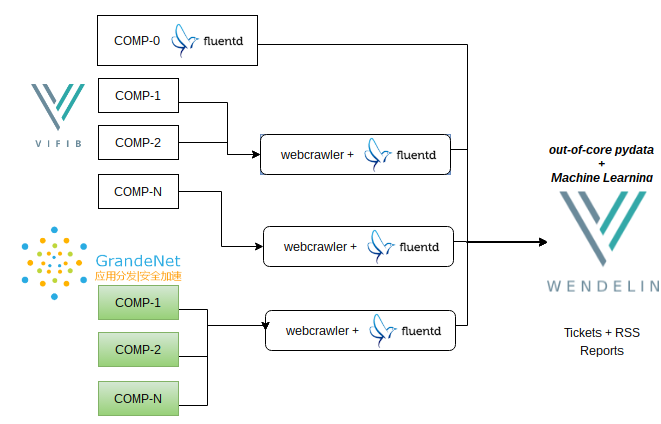
Pull + Push combination using webcrawlers instead browser...
Reports on Jupyter
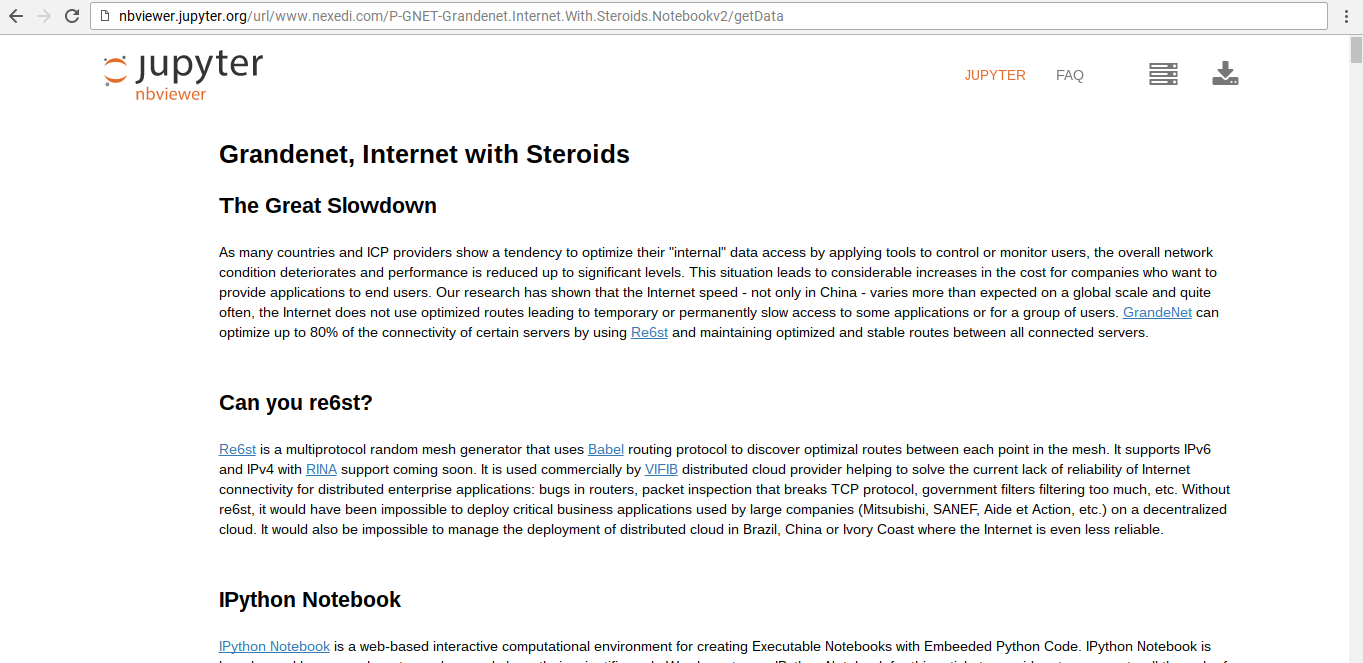
Grandenet, Internet with Steroids
Summary
Fully Python for collect data with psutil and standard library
Fully Python for out-of-core python with wendelin